i-Series - Особенности
High Performance Liquid Chromatograph
innovative
Automation and Remote Operation/Monitoring Encourage a New Style of Work
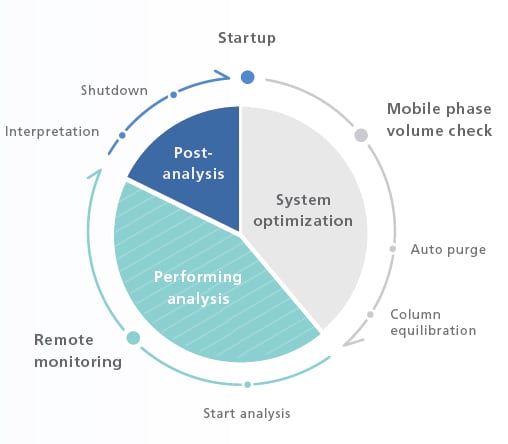
Analytical Intelligence functions, such as FlowPilot and mobile phase monitoring, and LabSolutions™ Direct can provide an automated workflow together with remote operation and monitoring from instrument startup to analysis completion.
Automated workflows incorporate the work-style habits of experienced analysts. The result is reliable data collected over extended periods.
Using Networks for More Improvements in Work Efficiency
LabSolutions CS allows remote operation and monitoring of all instruments on the analytical network from any locations, even from home.∗ Analysis data and reports are managed on a centralized database where administrative authorization allows managers to assign appropriate operational restrictions to operators, depending on their expertise and rank.
∗ Must have a network in place that is appropriate for the workflow.
Mobile Phase Monitoring
Advanced Real-Time Mobile Phase Monitoring
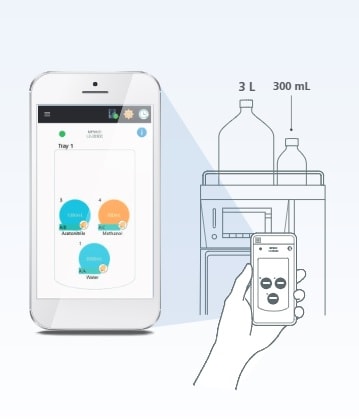
Making sure you have sufficient mobile phase in the system—before batch analysis—is critical to keeping your lab running smoothly. If you run out of mobile phase mid-batch, you have to stop the batch and take corrective action, resulting in costly workflow delays and potential loss of samples.
To overcome this challenge, the Mobile Phase Monitor*1 enables real-time, gravimetric monitoring of mobile phase levels to ensure maximum uptime. Levels for mobile phase or autosampler rinse solution may be monitored in up to six containers*2. A large bottle version is also available. The containers can also be checked remotely from a smart device (PC/iOS/Android).
∗1 Optional
∗2 Monitors up to 6 liquids when using 1-liter bottles, and up to 3 liquids when using large-volume bottles (2- to 5-liter bottles).
Mobile Phase Flowrate Control Function
Smart Flow Control Protects Columns
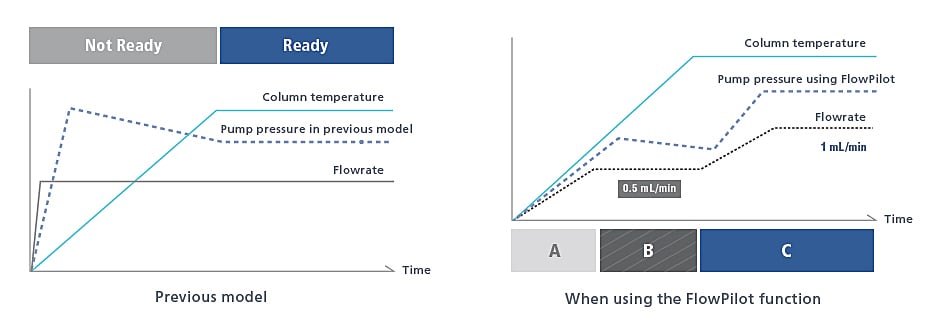
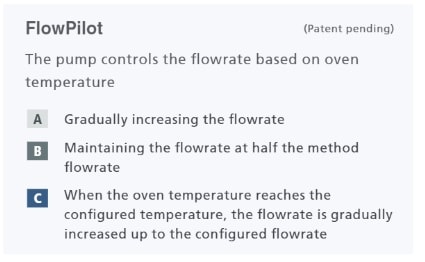
UHPLC columns can be damaged by sudden pump starts and extreme gradient changes, especially true with polymeric packings. Smart Flow Control (FlowPilot) increases the flow rate gradually to the method set point according to the status of the column oven, extending the life of your columns.
Remote Operation/Monitoring Function
Take Control of Instruments from Outside the Laboratory
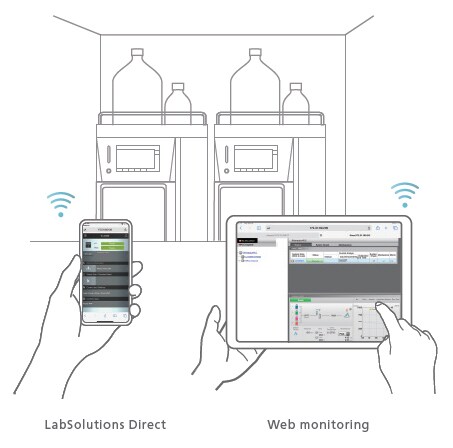
Using LabSolutions Direct, analysts can operate instruments remotely and implement pre-configured methods and batch analyses using the web browser of a computer or a smart device. Instrument status and chromatograms can also be monitored remotely to reduce the time and labor required to travel to and from the laboratory for improved work efficiency.
intelligent
Analytical Intelligence is not limited to automating an analytical workflow or remote operations. By aggregating and automating the knowledge and skills of experienced analysts, Analytical Intelligence enables anyone to obtain reliable data and analytical results. Analytical Intelligence is also designed for high levels of compatibility with other instruments and comes with a method migration function, thereby providing an environment where anyone is equally able to obtain data without the need for complex procedures related to data compatibility between different systems.
i-PeakFinder Automatic Peak Integration Function
Process Large Volumes of Data with High Precision in a Single Step
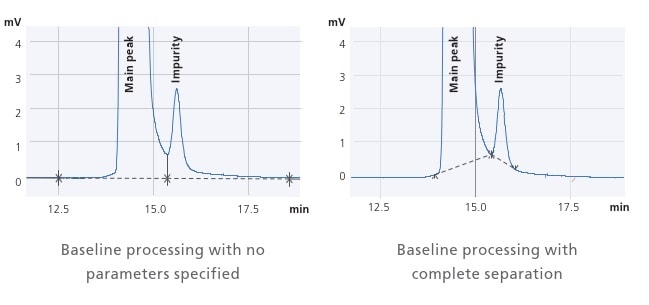
The manual integration of un-resolved peaks is a labor-intensive process and prone to inconsistent results depending upon the experience level of the user. Shimadzu’s proprietary i-PeakFinder peak integration algorithm is perfect for such situations. i-PeakFinder processes large volumes of data with high precision in a single step, saving a lot of time and increasing the consistency of results.
ACTO Method Migration Support Function
Considering Instrument Replacement and Method Migration
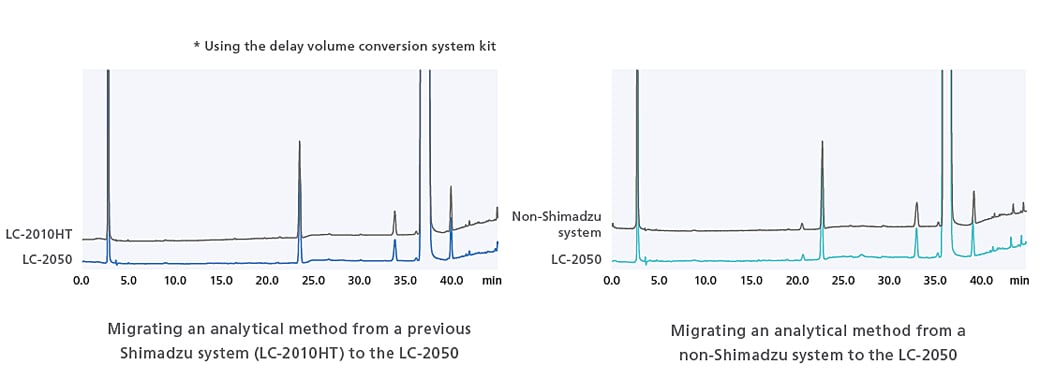
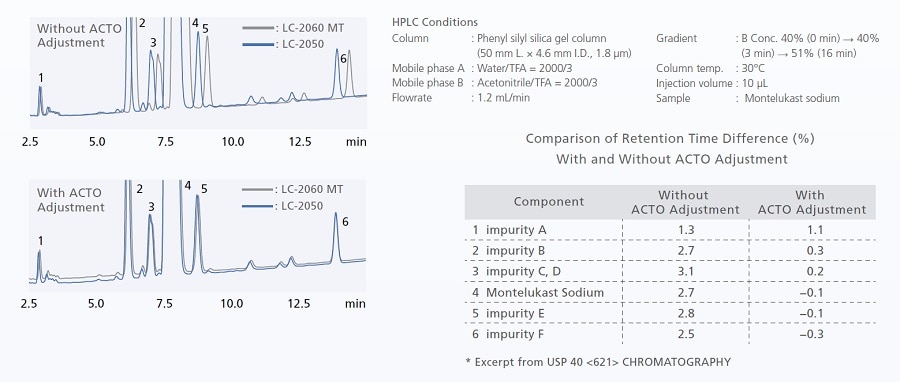
Migrating a test method (analytical conditions or method) from one instrument to another while obtaining the same chromatogram can be a challenging process. The i-Series is designed with the same internal system volumes as previous Shimadzu systems and competitor systems to ensure system compatibility and data reproducibility. An Analytical Condition Transfer and Optimization (ACTO) function also adjusts gradient start time automatically, so analysts can make adjustments to separations obtained by gradient analysis easily.
Note: The ACTO (Analytical Condition Transfer and Optimization) is the general name given to the method transfer/migration tools supplied by Shimadzu.
Compatibility Through Software Control
The ACTO function can be used to adjust gradient start times and allows analysis to be performed without any worries over the effects of piping volume.
ACTO allows you to adjust gradient timings without having to edit the gradient program itself, and as shown in the example below, the same sort of analytical results can be obtained using an existing analytical method with a larger system capacity to LC-2050. This gradient start time adjustment function can be used with all i-Series models.
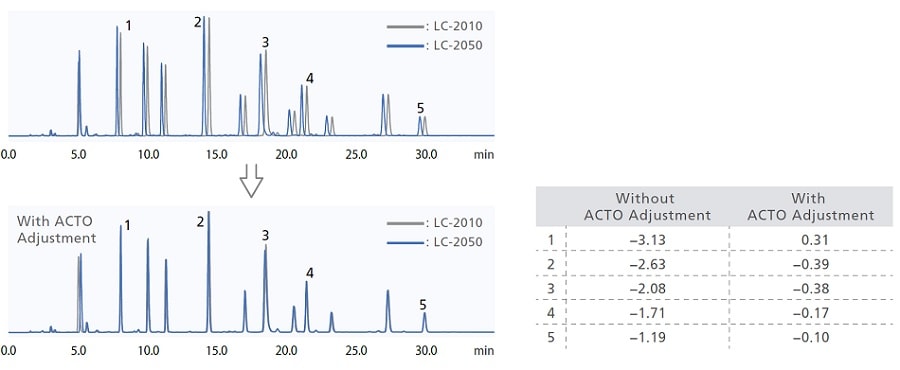
Using ACTO to Confirm Compatibility of LC-2050 and Previous Shimadzu System (LC-2010HT)
Related Application
Utilizing ACTO for US Pharmacopeia-Compliant Method Migration
Maintaining method compatibility during gradient analysis can be difficult due to differences in gradient delay volumes between models. Adjustment of the initial hold time using the gradient start time adjustment function (ACTO) enables method transfer compatible with USP <621>. Even when instrument models have different gradient delay volumes, analysis can be performed without replacing piping, etc.
i-PDeA II Peak Deconvolution Function
Tools to Help in Dealing with Difficult Separations
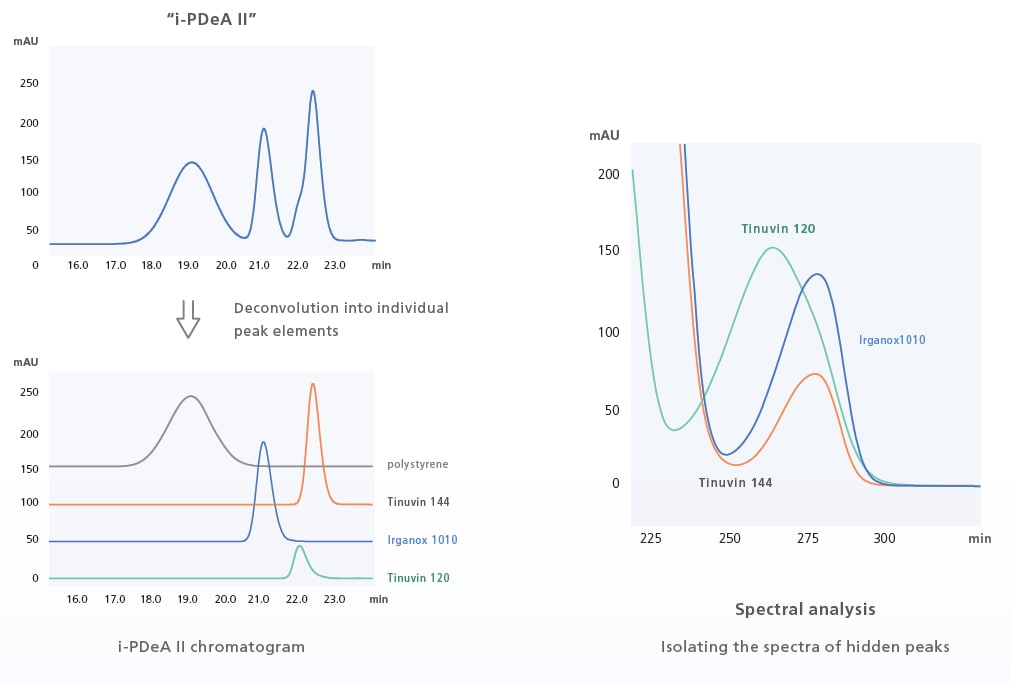
The i-PDeA II peak deconvolution function uses a multivariate curve resolution alternating least squares (MCR-ALS) method to enable qualitative and quantitative analysis of peaks not fully separated by the column. The i-PDeA II can also be used to check the purity of target peaks. (Only available when using a PDA detector and LabSolutions.)
intuitive
User Interface
Simple in Operation
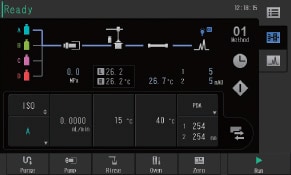
The user interface replicates the system flow channel and is used to visually check the operating status of the system. Method editing can also be performed from the same screen. With its intuitive design, even users who are completely new to liquid chromatography can navigate the user interface with minimal training.
Maintenance Videos
Supporting the Replacement of Consumables
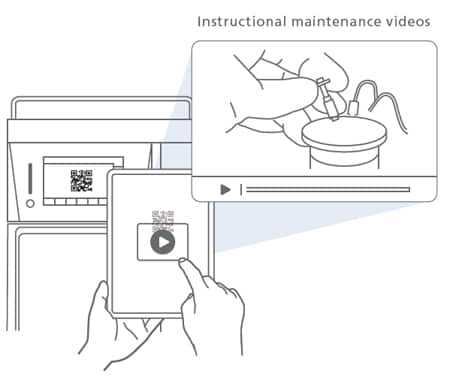
Reading a QR Code® shown on the touch panel directs the user to a website with instructional videos on maintenance. This feature helps improve system availability and increases efficiency.
Auto-Validation Function
Stable Operation Assured with Smart System Startup
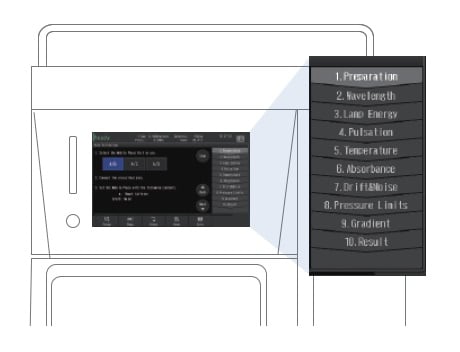
An auto-validation function means anyone can follow a set procedure and verify the instrument condition easily. The auto-validation function examines solvent delivery stability, wavelength accuracy, absorbance accuracy, gradient accuracy, the presence of any drift/noise, and other parameters. Also, an instrument check function automatically carries out the routine inspections performed before instrument operation and creates a report showing system self-diagnostic results along with a record of consumables usage, including total solvent volume delivered by the delivery pump, total number of injections performed by the autosampler, and the number of hours the lamp has been illuminated. The system check function also manages auto-validation results, making it easy to accurately determine the operating status of the instrument.
Starting Auto-validation
Procedures, mobile phases, and other information necessary for validation are displayed on the screen, allowing you to perform inspections by simply following the instructions.
Creating a System Check Report
Validation results can be viewed from the i-Series main unit. Validation results can also be output in a report format from a workstation.
Automatic Pretreatment Functionality Increases Work Efficiency
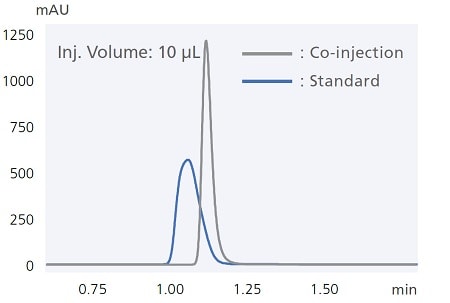
Example of peak shape improvement by co-injection of diluent solvent
i-Series autosamplers include easy-to-use automatic pretreatment functionality. For example, co-injecting samples together with the diluent solvent (co-injection) ensures reliable analysis even when using sample solvents that tend to cause peak distortion. That functionality can also be used to react samples with reagents inside the sample loop. The chromatogram below shows results from using this function to pre-label amino acids with a pre-labeling reaction with OPA/FMOC reagents. Analyzing the entire aspirated sample quantity enables high-sensitivity analysis while minimizing reagent and sample qualities required.
Related Application
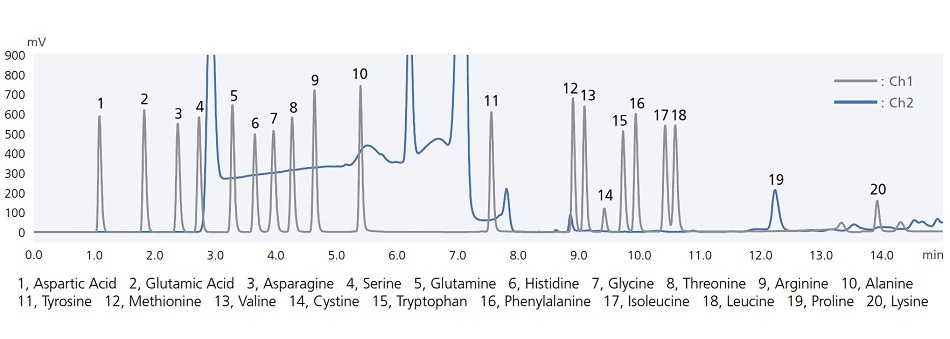
Amino acid analysis by automatic pre-column derivatization
Related Application
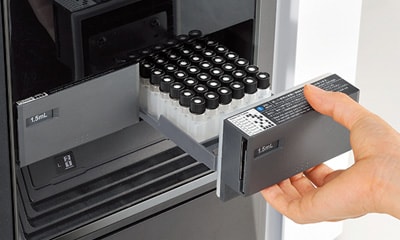
Open Access Sample Placement
A direct access mechanism on sample racks allows the user to place the sample on racks that are not involved in sample injection even during analysis. Furthermore, racks can be shared by multiple analysts, without interrupting the analysis of samples placed by others. Overall, this function enhances work efficiency.
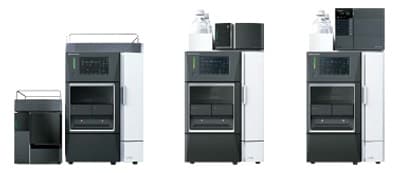
Even if an Optional Detector is Added, the Installation Area Remains Small
Even if an optional detector is added, the installation area remains the same. That means a PDA detector, fluorescence detector, differential refractive index detector, or a compact mass spectrometer can be added to a UV detector model. Of course, data can be acquired simultaneously from the standard and added detectors. The i-Series offers excellent extendibility while still providing easy operability due to its integrated configuration
Dual-Temperature Control with TC-Optics and Flow Cells
Excellent Baseline Stability
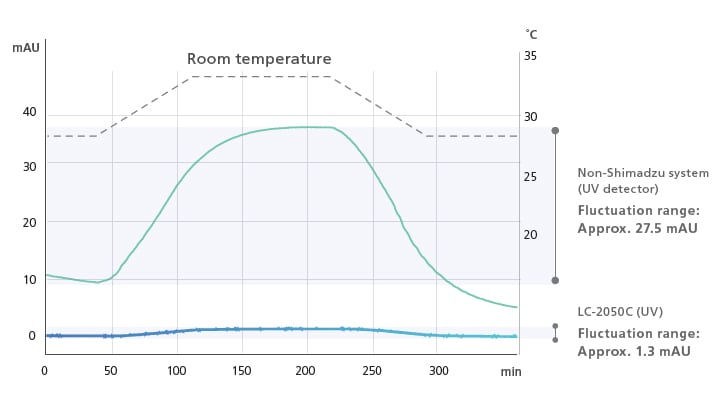
In addition to the temperature control function for flow cells, the i-Series employs new temperature control technology for detector optical systems, known as TC-Optics (Temperature Controlled Optics). This ensures a more stable baseline that is less susceptible to room temperature variation and increased precision during verification testing and quantitative testing of trace components.
Ultra-Low Carryover Performance Enables High-Sensitivity Analysis
Improved Reliability of Trace Component Analysis
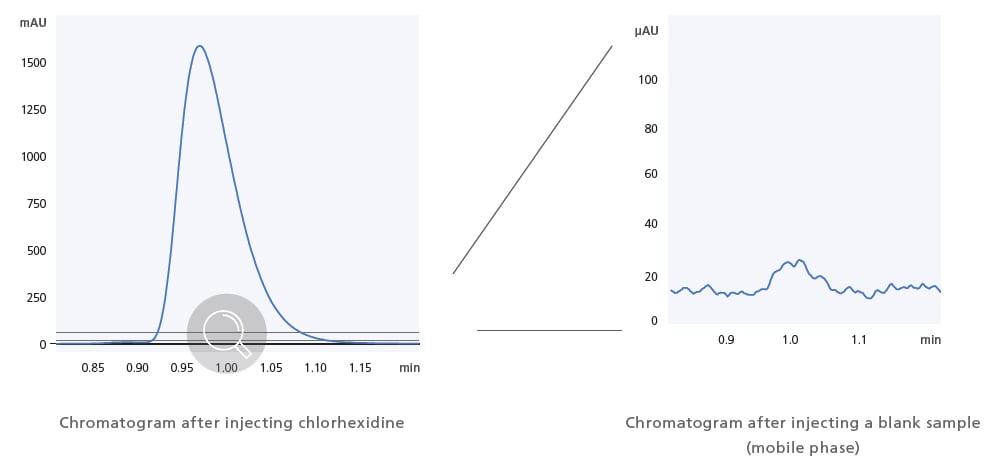
Shimadzu’s proprietary flow channel design, parts, and materials reduce the carryover effects of sample residue to almost zero. Ultra-low carryover performance has been improved to 0.0025% (chlorhexidine, assigned conditions), thereby providing highly precise quantitative performance when analyzing complex samples.
Support for Low-Temperature Analysis (Optional)
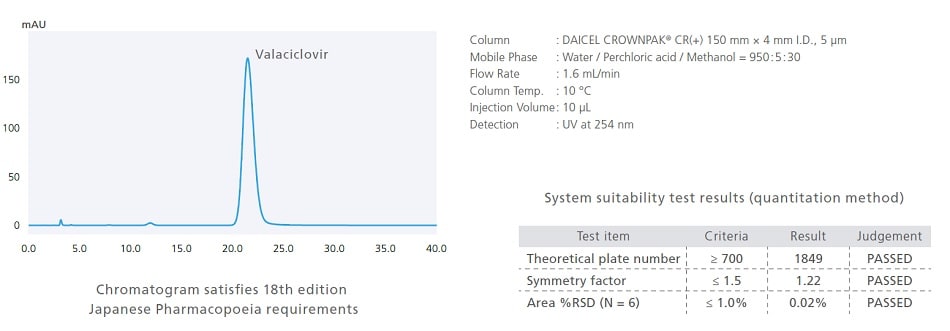
Pharmaceutical analysis can sometimes require analysis at lower temperatures. Therefore, the i-Series includes an optional low-temperature analysis unit for supporting such analytical conditions. With the optional low-temperature analysis unit installed, the oven temperature can be controlled down to a room temperature −15 °C. The following is an example of analyzing valaciclovir, a drug listed in the 18th Edition of the Japanese Pharmacopoeia. It specifies a temperature of 10 °C in analytical conditions for quantitative testing.
Dedicated Software Improves Method Development Efficiency
Using LabSolutions MD method development software, methods can even be developed using an i-Series system. LabSolutions MD enables efficient analysis method development using an “Analytical Quality by Design” (AQbD) approach for designing analysis methods based on science and risk. LabSolutions MD can be used for the entire workflow, from creating an analysis schedule based on the experimental design, automating acquisition by switching between mobile phase, column, and LC parameters, and determining optimal analytical conditions by creating a design space, to performing validation.
Automatically Tracking Chromatogram Peaks
LabSolutions MD includes functionality for identifying peaks based on a combination of parameters. In the example on the right, the fumaric acid retention time varies significantly more than other peaks depending on the acid concentration and column oven temperature. To automatically identify each peak despite the elution order of fumaric acid changing with respect to other peaks, only the maleic acid peak, which does not change order with fumaric acid, was filtered based on both peak height percent and elution order, whereas the peaks for other components were identified based on elution order only.
Identifying the Most Robust Analytical Conditions by Visualizing Optimal Separation Parameters
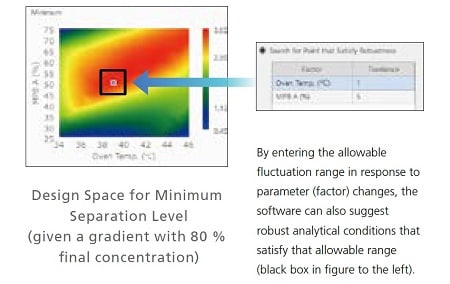
For initial screening, multiple parameters in analytical conditions, such as the organic solvent concentration used for the mobile phase and the column oven temperature, are specified automatically. Then the effects on separation due to variation of each parameter determined from that process can be displayed visually. For example, the design space on the right shows organic solvent concentration of mobile phase B plotted on the vertical axis and column oven temperature on the horizontal axis. That makes it easy to see at a glance that an organic solvent mixture ratio of 50 % and a column oven temperature of 39 °C are the most robust analytical conditions.
Predicting Chromatograms from a Design Space
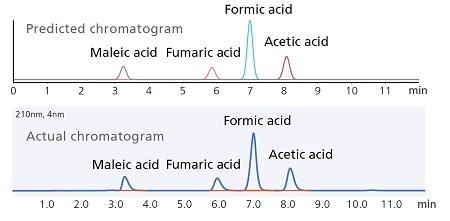
The effect of analytical condition changes on chromatograms can be visually estimated by clicking on any corresponding point in the design space. That means changes in separation behavior in response to any particular change in analytical conditions can be checked before starting an analysis.


